Every member of a Stream can create their own custom analytics dashboard for that Stream. The Analytics dashboard is member-specific and visible only to that member. Members can create various chart types for project visibility and tracking.
Create a chart
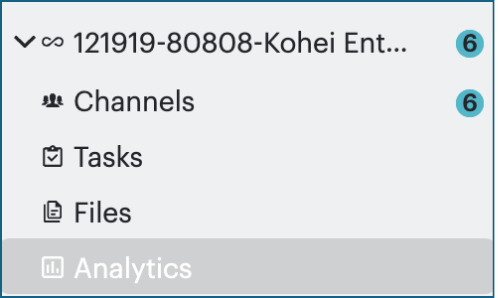
- Click on Analytics, located under your Stream name.
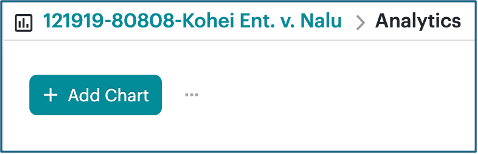
- Click + Add Chart.
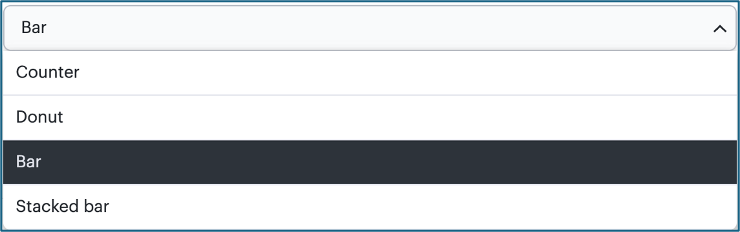
- Name your chart and then click the Chart Type drop-down menu to select an option. Once you create your chart, you will not be able to change the chart type.

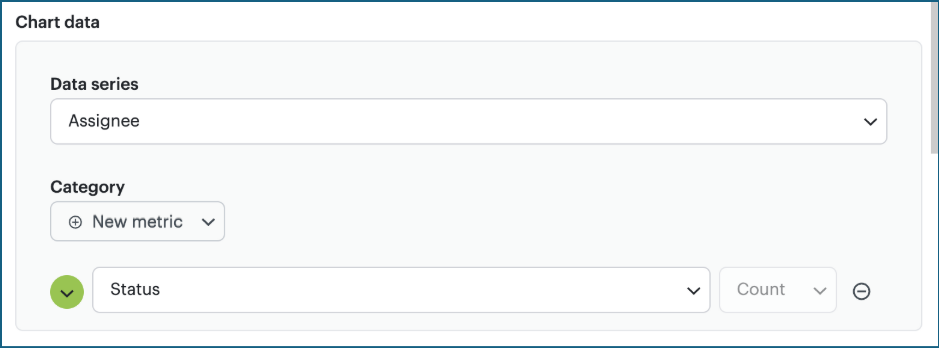
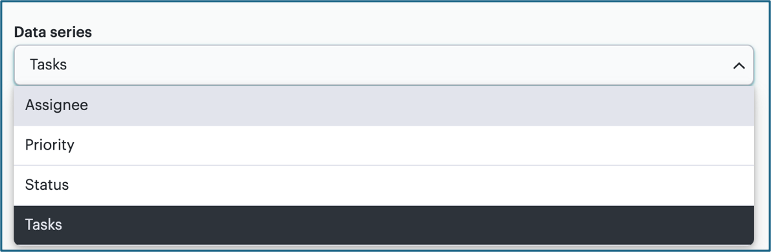
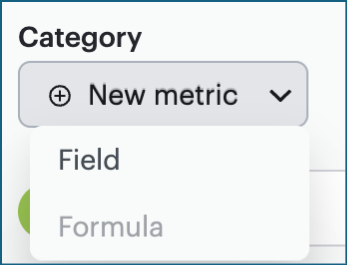
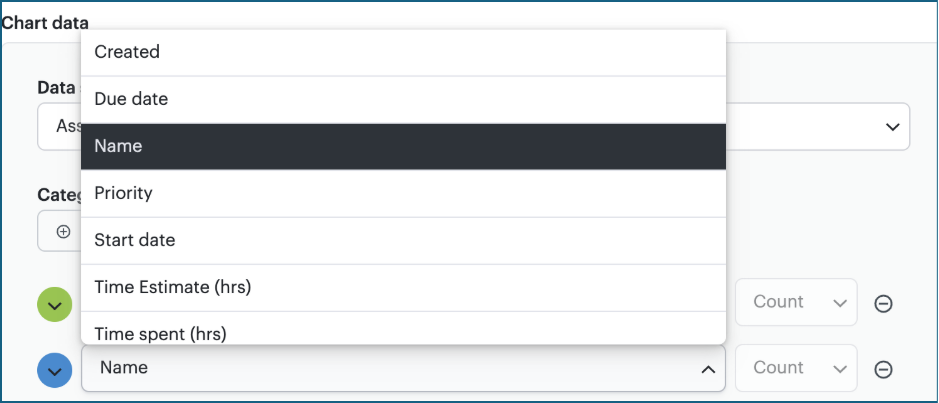
- Based on the chart type selected, you have the option to modify Chart Data, including Data series and add additional Categories:
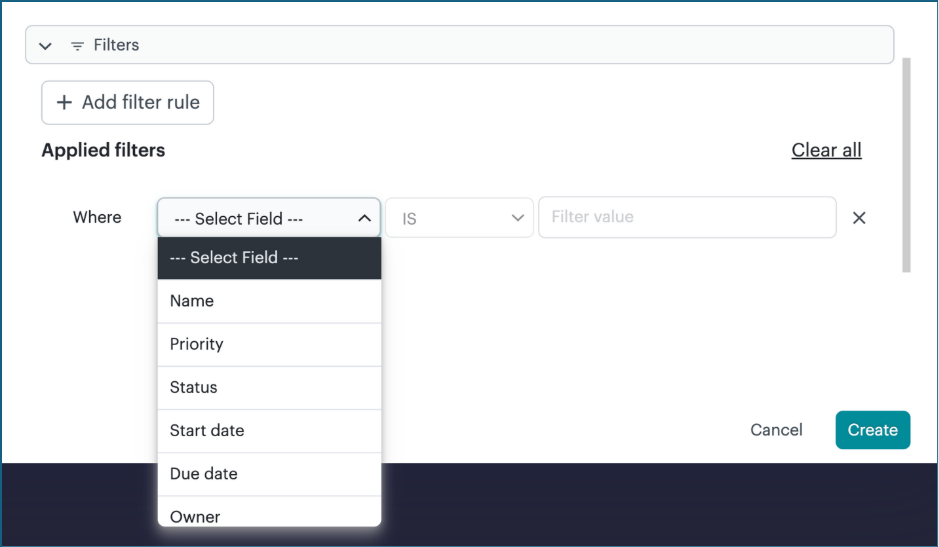
- Apply a Filter if needed and click Create.
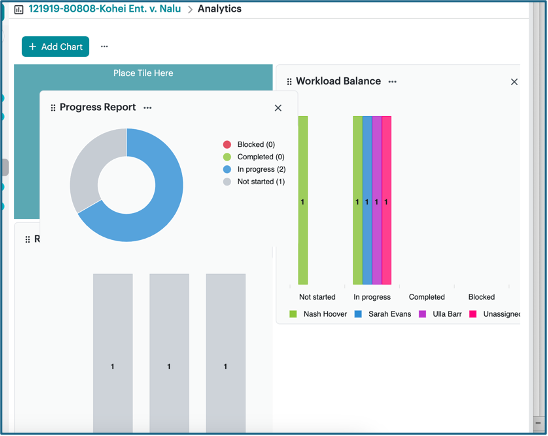
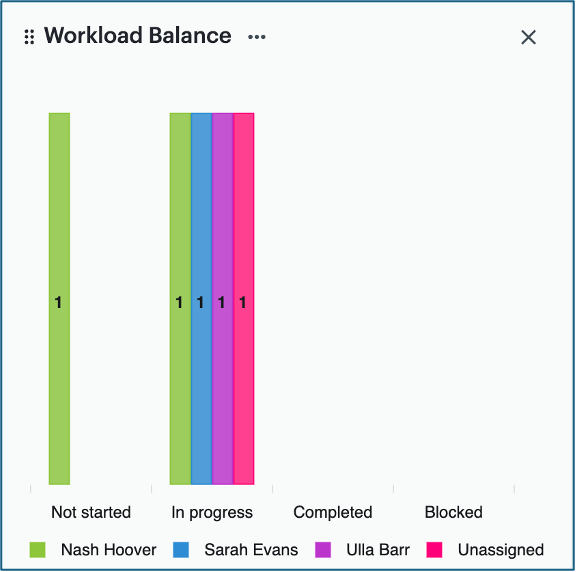
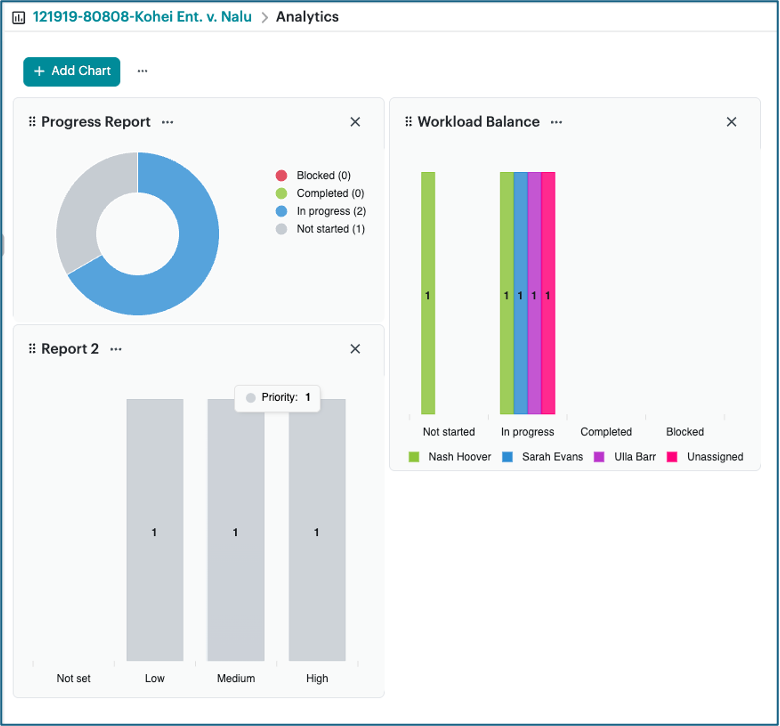
- Your chart is ready to view on the Analytics dashboard, along with any other charts you’ve created.
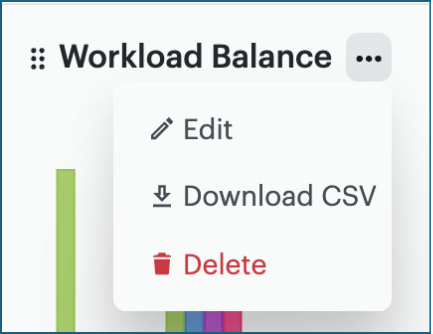
Modify or manage your charts
To edit, download, or delete your chart, click the “…”.
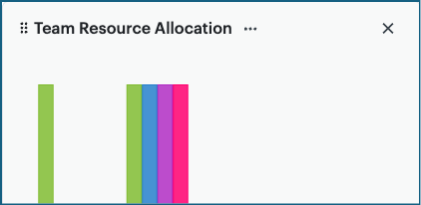
To hide a chart, click the X in the upper right corner of the chart. This does not delete your chart but hides it until you need it.
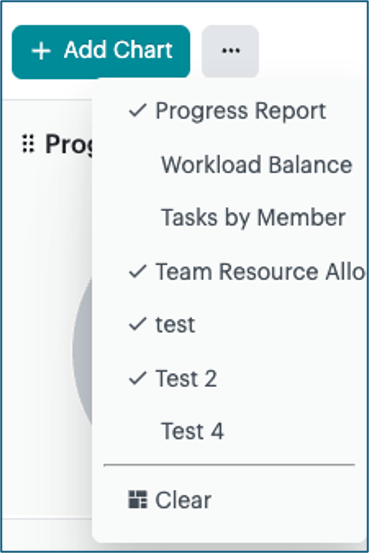
To display a hidden chart, click the “…” next to the + Add Chart button, and select the chart you want to see. The charts with a check mark are already displayed on your dashboard.
To rearrange your charts, click and hold the chart from its upper left corner and drag the chart to where you want to place it.